REPORTING & ANALYTICS
The numbers, the moment you want them
Live dashboards, scheduled reports, and a clean data layer ready for Power BI, your ERP, or your own tools.
FROM DATA TO DECISION
Every transaction, turned into something you can use
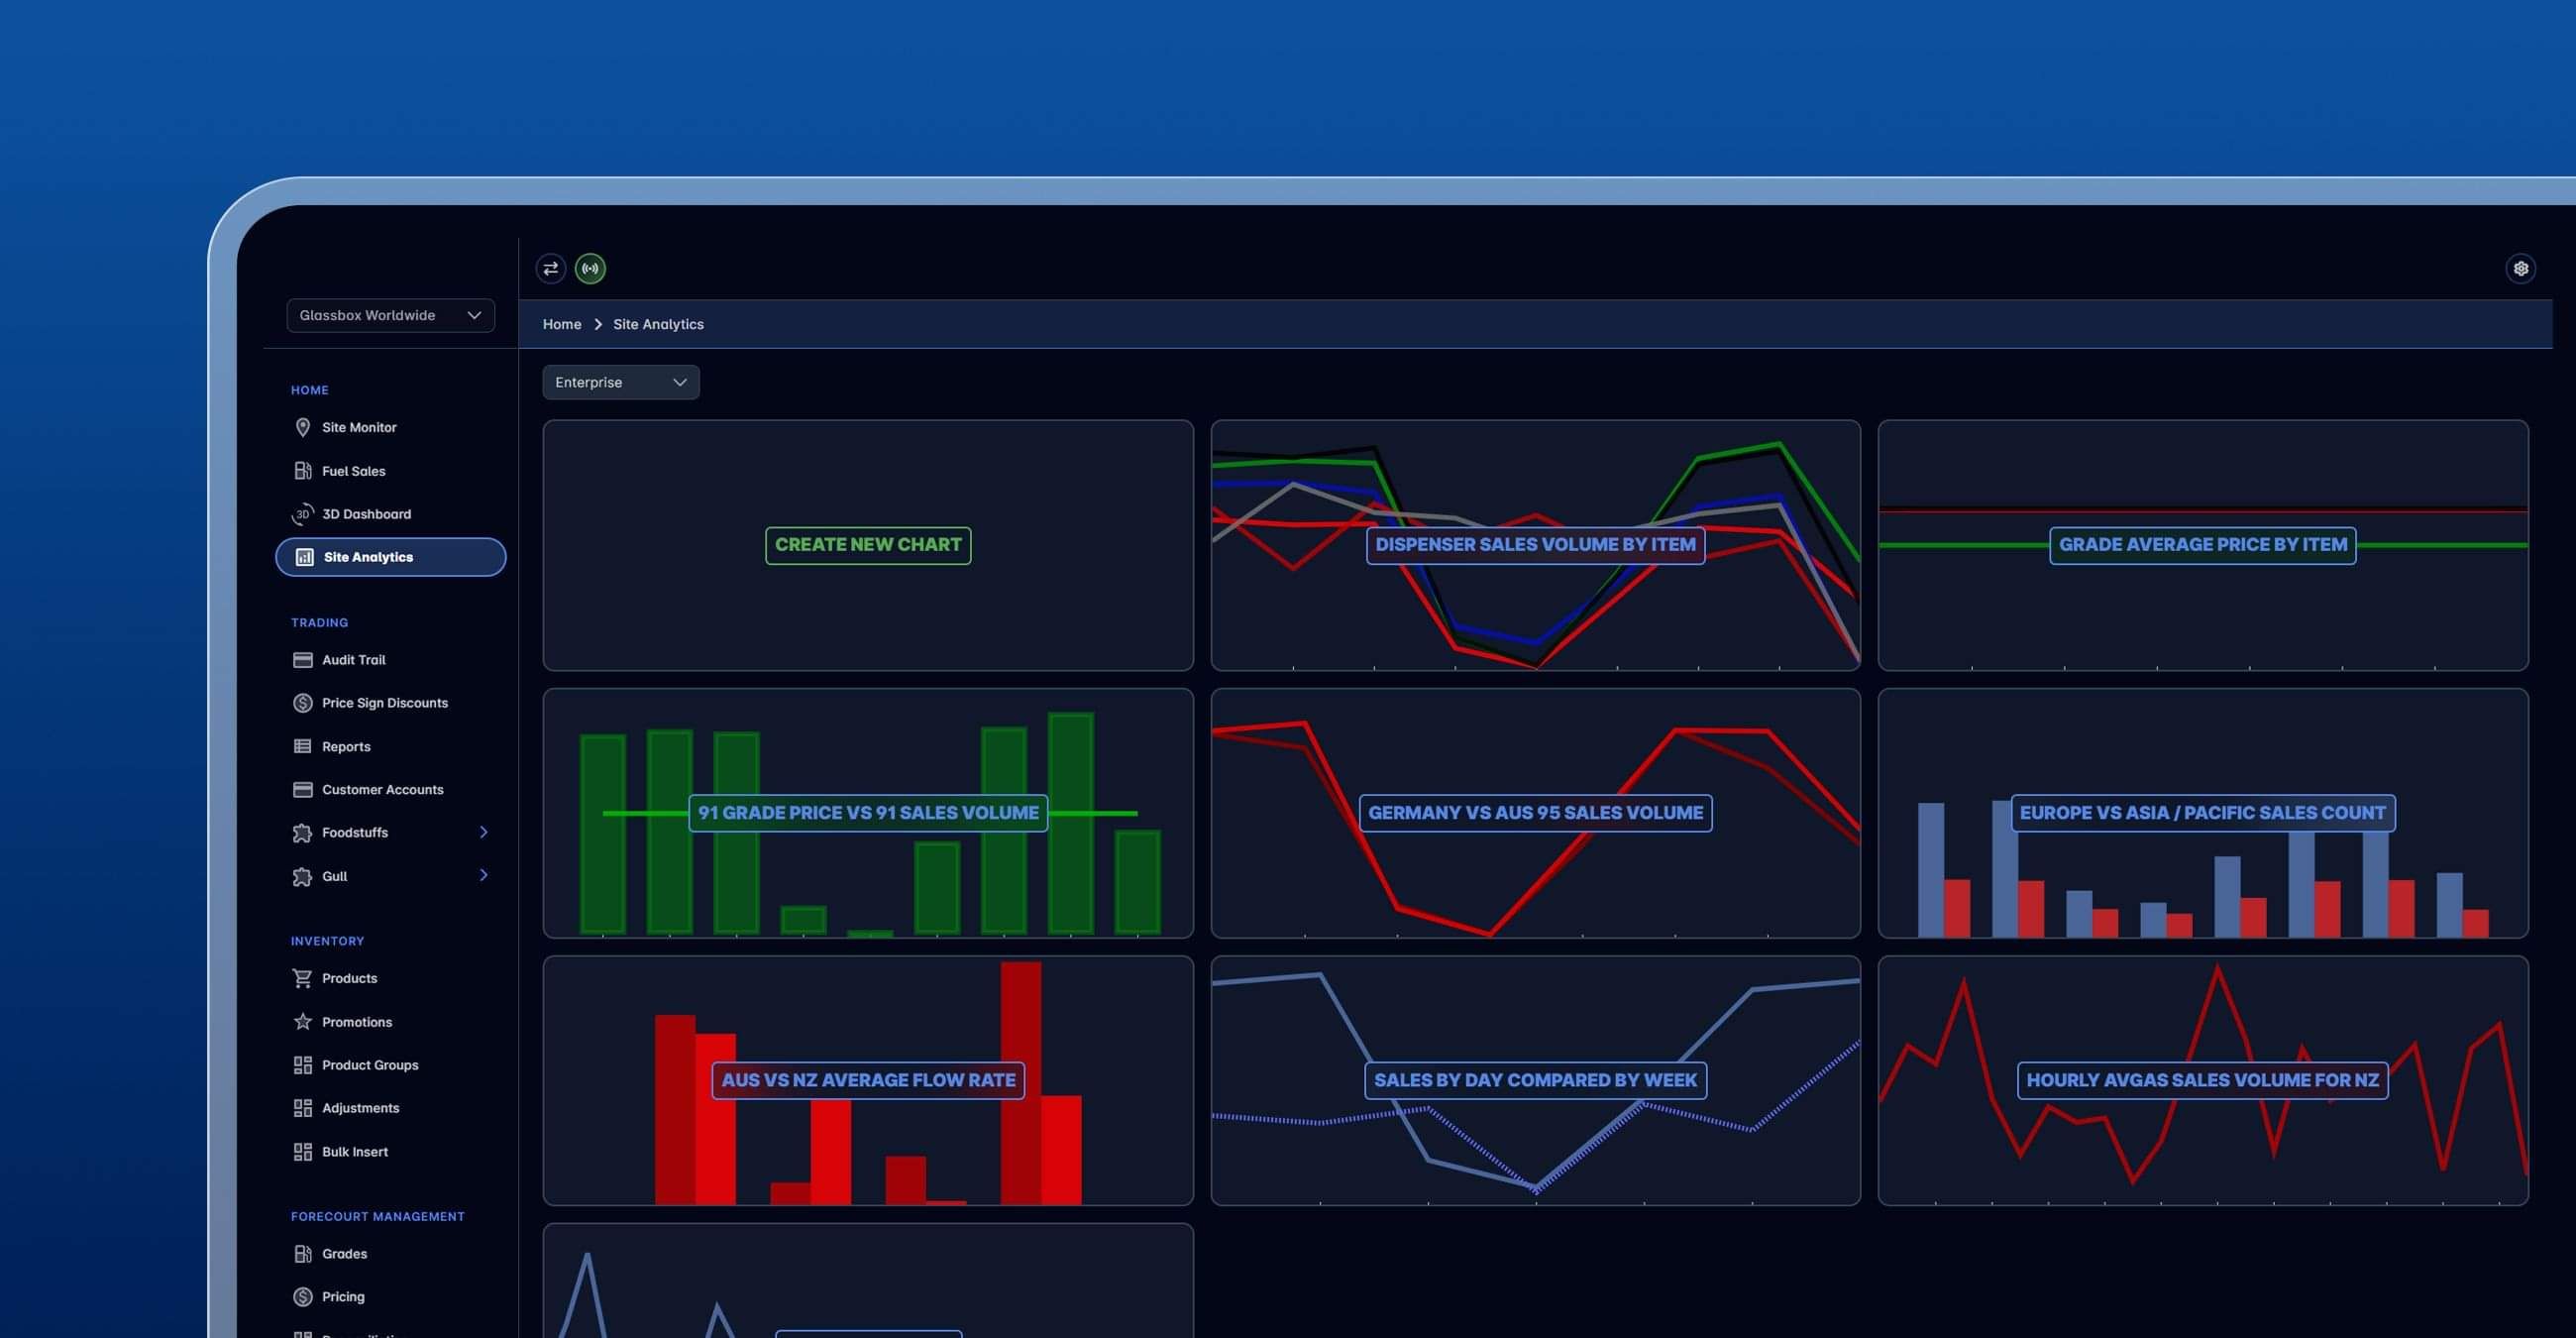
Head Office is already capturing everything that happens on your forecourts. Reporting & Analytics turns that stream into a picture you can act on. Sales by grade, by site, by tender, by hour. In dollars or in litres. Today, this week, this year. The view changes the instant you change the question.
THE LIVE PICTURE
Sales, as they happen
By grade
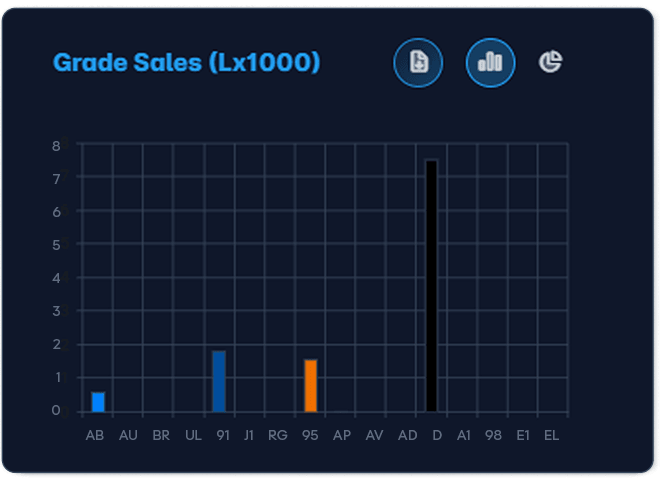
Headline numbers for every grade you sell, 91, 95, diesel, AdBlue, in dollars and in litres, with a single toggle to switch between them.
By time
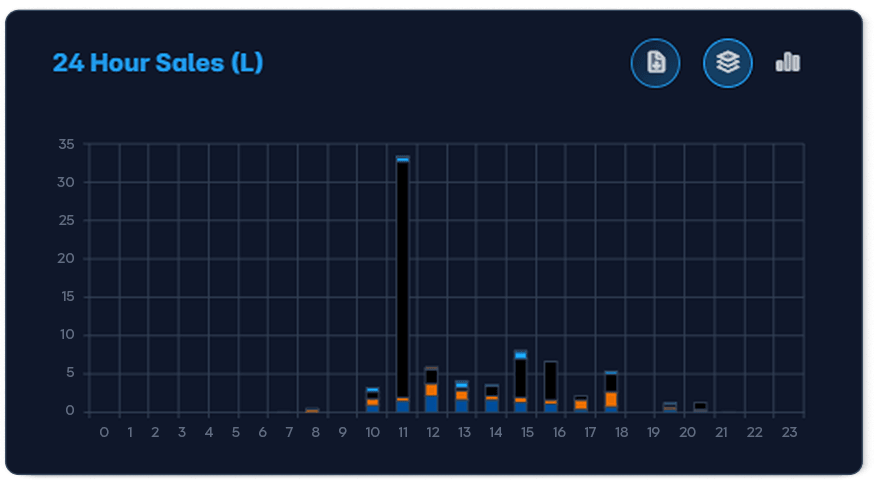
Today, this week, this month, this year. A 24-hour view that shows you exactly when your forecourt is busy and when it isn't.
By tender
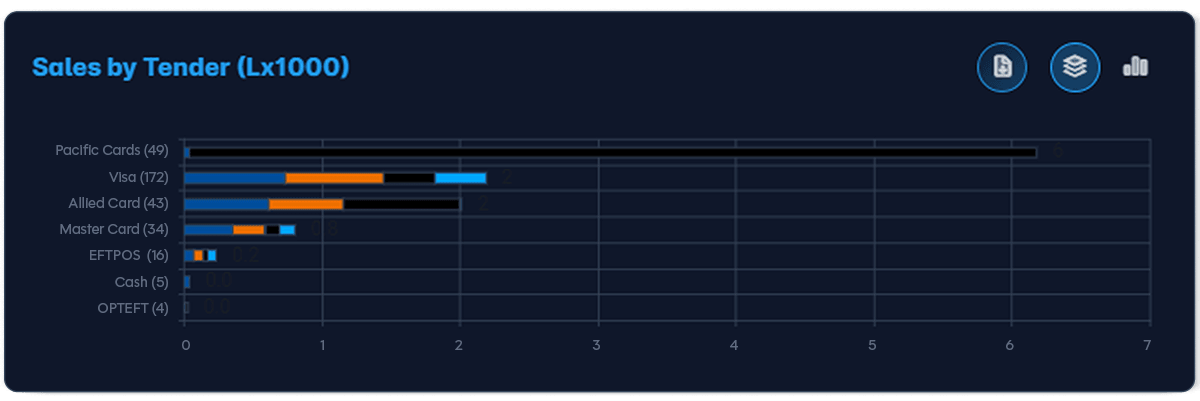
See how customers are paying. Card, account, whitecard and more, broken down so you understand the mix behind the revenue.
THE REPORT THAT SENDS ITSELF
Set it once. It lands in your inbox
Build the report you need, set the schedule, and let it run. Daily sales, weekly variance, monthly performance by site. The right numbers reach the right people on time, without anyone logging in to pull them. Reports that used to get built once and forgotten now just turn up
THE WHOLE NETWORK AT ONCE
Compare sites. Spot the outliers
Pull back from a single forecourt to the whole network and the picture changes. Rank sites by sales. Spot the location that's drifting. Watch trends build across the group before they show up in the monthly accounts. The bigger your network, the more this view pays off.
BRING YOUR OWN STACK
Use your data in the tools you already use
Not everyone wants to live in our dashboards, and that's fine. Head Office exposes a clean, documented data layer through our REST API, so your team can pull the numbers into Power BI, your ERP, or your own reporting tools. The data is yours. Use it wherever you like.
See your own numbers, live
Book a demo, and we'll show you the analytics running on a real network.

CONTACT US


